The Contrarian Truth driving Digital Business
A core truth about "digital business": we will only really succeed by understanding how to connect with people.
I haven't written one of these hands-on hardware / software evaluation posts for some time - it's not that kind of blog, really - but I've been asked a lot of questions about my Surface Pro 3, and this is an easy way to let many folks know the answers. Also - I am making some interesting discoveries with the new device - some you might not think about at first. Am I surprised by some of these issues? Yes…
A real-life journey of self-discovery that gave me insight to the impact of transformational change to the organization. Get out of your comfort zone once in a while, to have meaningful empathy with the team you are trying to change.
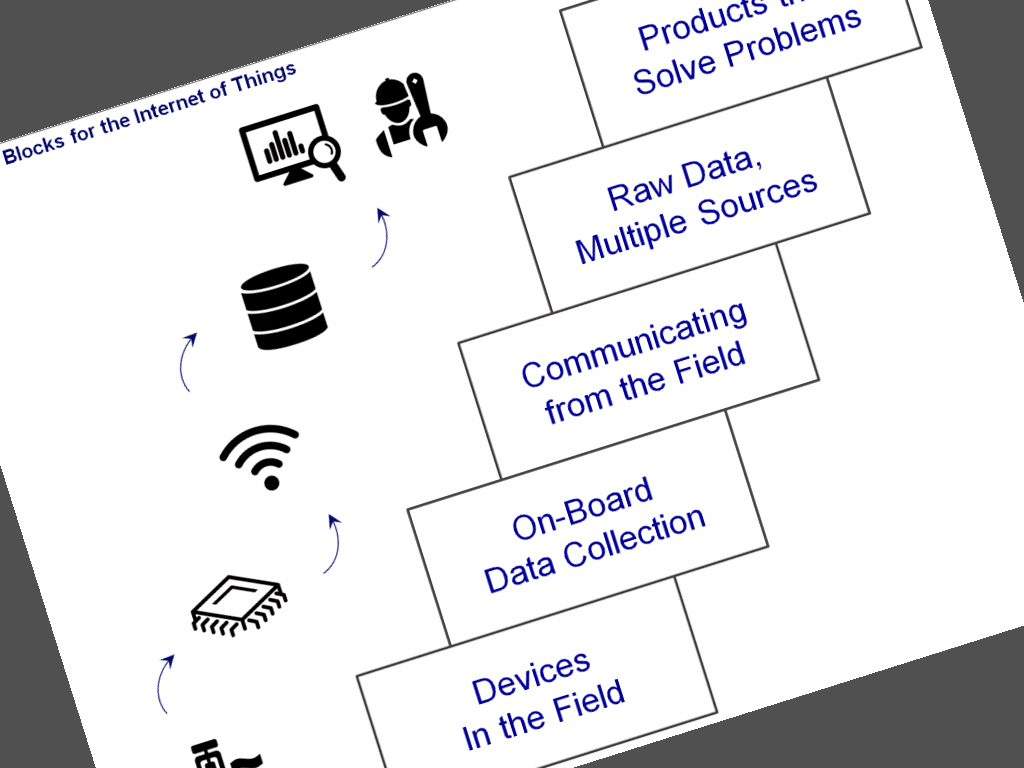
Accelerate your IoT exploration with this simple framework for explaining the building blocks of IoT solutions; target the areas that present the biggest unknowns.
When introducing a new topic like the Internet of Things, you may be disappointed - at first. Your organization is still waiting; when will we think a little longer term? How to be ready for opportunities that may present themselves.
Most manufacturing companies face challenges when contemplating Digital Products and the IoT, because they are not making Highly Valuable Things or Mass-Market Things, but Specialty Things – niche products with very targeted appeal. And “Information as a Product/Service” will be a radical departure.
Few cloud computing vendors are able to produce a plausible cost model with any level of detail. All of your SMB customers are asking the same question, so why don't you have a simple, clear, canned answer? In the absence of a vendor model, this article will help you quickly work up the big chunks of the opportunity in short order.
Focus on a better definition of Success - one that delivers results. Quantifiable change, improved operations, smarter people, profitable top line growth - there is a big difference between deliverables and meaningful results.
We've got the activity captured, and now we have "effectiveness" ratings for the people in the group - how will we put them together and see a relationship? Mechanically, this is a simple XY scatter graph - a standard chart type in both Excel and Google Docs. Let's take a look at a sample data set that illustrates the idea: This is the picture I expected to see: the more you use the system (the X axis), the more results…
How to build a simple, easy-to-understand business benefits model for preventative maintenance investments; you have to model the risk of failure. Fear not - this simple calculation will do the trick.