My last post generated some interest, so here’s the rest of the examples.
Last time, I wrote about the simplistic approach to measure and report on IT value:
- Is your IT group working on the right things?
- Are they working on the right things well?
- Is your IT spend comparable to industry norms?
- Is your IT spend comparable to other measures of company performance?
A bit more detail … balancing quantitative and qualitative …
- (Quantitative) To make sure you have business alignment, the strategic objectives of the company should be identified, and all projects / IT investments should be aligned with those objectives. Track the relative size of spend for each of the objectives, and make sure it matches with your priorities (sample in previous post …)
- (Qualitative) Regularly (i.e. minimum once per quarter), review this aggregated spend with the business. Conversation around relative priority can easily segue into a “customer satisfaction” review.
- (Quantitative) Check with industry groups or research firms to get an idea of the typical measure of IT as a percent of revenue (ex. IT budget of 1.5% revenue is typical for manufacturing firms). Be sure to clarify if this includes depreciation expense or not.
- (Quantitative) For many companies, revenue isn’t directly impacted by IT as much as Cost of Goods or SG&A. It may make sense to compare annual growth rate of year IT budget to your company’s gross margin.
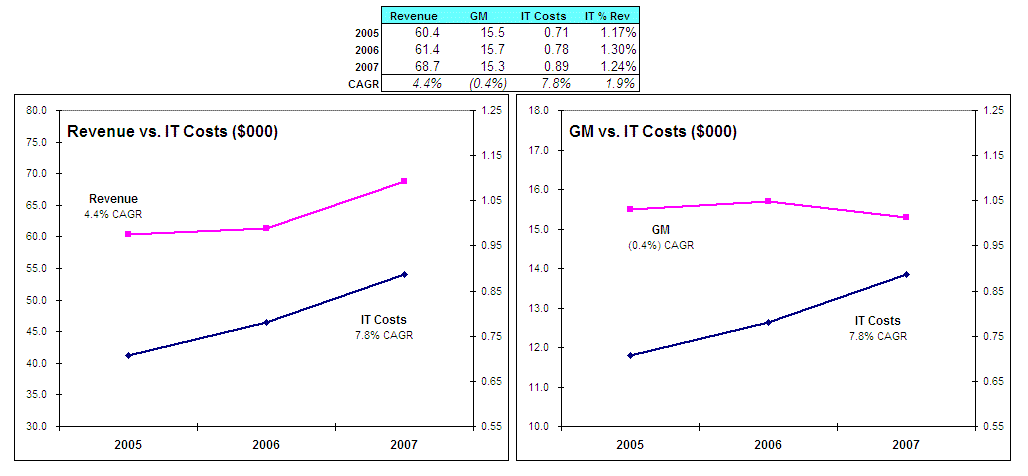
Here is a sample graphic showing what I mean …

For this fictitious manufacturing company, IT costs seem to be in line with industry norms – comfortably less than 1.5%. However, IT costs are growing faster than revenue – not a good sign.
Worse yet – the second graph shows us that our gross margins are flat to declining – more bad news. If I was the IT director at this company, I shouldn’t be surprised by some serious budget pressure going into the new year.
Again, these are made-up numbers to illustrate one scenario. There are also things one can do with the graphs to hide problems or inflate good results – but the CAGR statistics tell the real story, so make sure you know how to calculate growth rates!
Another key point; generally speaking, for most manufacturing companies, IT investment is not as clearly related to revenue as it is to gross margin. In fact, for some companies, revenue increase/decrease is often driven by forces outside of IT’s influence!


Comments (0)